 Overall, all our presentations went well. I had some technical difficulties, but I was so happy to be able to have results to share with my community that has supported me. Also... Mr.Mann at the end of the night gave all the seniors lab coats. Yes, I repeat, LAB COATS!!!! Hence, the Dexter gif and him being all fabulous and science-like. | Symposium June 4th I presented at my last symposium at MCS. It was a bittersweet night. Our speaker was a professor that helped Julian with his summer research. He talked about dying native languages in Mexico and other Latin American countries. One aspect of his presentation stuck in my head. It was the idea that tradition is diminishing. Individuality among cultures is now looked down upon because we should be united and strong. This conflict still is unsettling to me. I have no idea which is worse, not helping those in need because it would mean to diminish their own preserve of identity or to help less advanced cultures, advance at risk of what makes them who they are. |
|
0 Comments
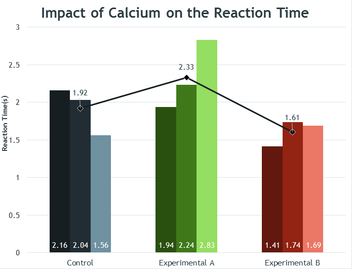
As mentioned in my last blog post, I was able to support my hypothesis. However, you may be wondering, how I determined if my results were significant... This post will guide you through how I did my statistical analysis. . Experimental Question: Does calcium have an impact on the reaction time of the leaflets of the Mimosa pudica? Hypothesis: The influx of calcium within the Mimosa pudica will decrease the reaction time of the plant’s leaflets to a physical stimulus alluding to the presence of possible Ca2+ driven transport mechanism, such as an actin-myosin interaction within the plasmodesmata.
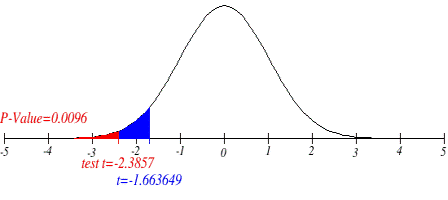
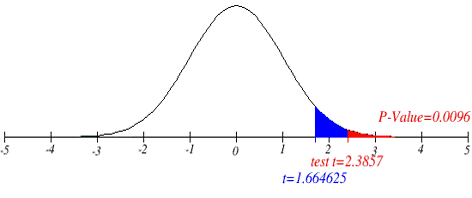
The p values for both are also presented on the graphs. Data is deemed significant if the P-value is less than the alpha level. Which, in both of my cases my p value was less than .05.
I have my results, my experiment is done... Are you ready to find out more?
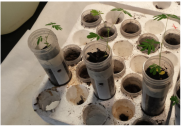
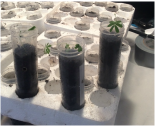
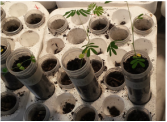
Experimental Design and Analysis: Plants of Mimosa pudica L. were grown in the lab in test tubes full of a soil culture. The plants were grown under grow lights and given 12 hours of direct light and 12 hours of darkness. There were three groups of plants (control, experimental A and experimental B) and three plants in each group, each was given two pipets of designated nutrient solution every other weekday. Every weekday all the plants were given three pipets of distilled water.
Recordings were taken with a Samsung Galaxy S4 phone. The videos were immediately sent to Google Drive and labeled by date, plant and test number. All recordings were taken of the stimulation of the first set of leaflets of each plant. All plants were touched using a plastic rod. Video Analysis was conducted by using Windows Movie Maker, a preinstalled program with Windows 8, the videos were slowed down by x .125. This allowed more frames to been seen per second. Next, the point of initial contact was found and the video was spliced. After, at the point when the plant ceased to react or move its leaflets, the video was also sliced. This section was isolated and the recording was brought back to the original speed. The time given would be the assumed reaction time of the plant. Fifteen tests were done for each plant. A total of 45 tests per group. Essentially, the recording is used as a visual stopwatch.
I was able to support my hypothesis that calcium shortens how long it takes for the Mimosa pudica to respond. Check out my other blog posts that discuss the significance of my results, the statistical analysis of my data, further research, my last symposium at Margaretville and my future.
|
My Update on Current Researchthe breakthroughs, the hardships, the cool stuff, and the not so cool. Archives
June 2015
Categories |

 RSS Feed
